Software architecture diagrams are a powerful way to visualize, understand, and communicate the structure of a system. For software engineers, clear and concise diagrams ensure the entire team can align on the technical vision, making it easier to manage complexity and foster collaboration. However, traditional approaches to software architecture diagrams often fall short, leading to confusion, miscommunication, or overly complex representations. This is where the C4 Model comes in—a structured and layered approach designed to simplify and clarify software architecture at different levels of detail.
In this article, we will explore the C4 Model in depth. We’ll walk through its four layers—Context, Container, Component, and Code—and how they help engineers create scalable, maintainable architecture diagrams. Additionally, we’ll review best practices, tools, and common pitfalls to avoid when adopting C4 diagrams in your software projects.
1. Introduction to Software Architecture Diagrams
1.1. Definition and Importance
Software architecture diagrams serve as the blueprint for a software system, illustrating the overall structure, key components, interactions, and technologies used. These visual representations help engineers understand how different parts of the system interact, clarify the responsibilities of each element, and make decisions about scaling, security, and performance.
The importance of software architecture diagrams lies in their ability to:
- Communicate complex systems clearly to both technical and non-technical stakeholders.
- Serve as a reference for development, ensuring everyone is on the same page.
- Help identify and address potential design flaws before implementation.
- Aid in onboarding new team members by providing them with a visual overview of the system.
1.2. Common Challenges in Understanding and Communicating Architecture
Despite their usefulness, software architecture diagrams often suffer from a few recurring issues:
- Over-complexity: Too many details can overwhelm viewers, making it hard to grasp the big picture.
- Lack of clarity: When different aspects (e.g., deployment, data flow, and interaction) are mixed into one diagram, it becomes difficult to interpret.
- Inconsistency: Diagrams may become outdated as the system evolves, leading to confusion.
- Ambiguity: Without a standardized approach, diagrams may differ significantly between teams or projects, making them hard to interpret across organizations.
The C4 Model addresses these issues by offering a clear, hierarchical structure to diagramming software architecture.
2. Introduction to the C4 Model
2.1. Overview of the C4 Model
The C4 Model was created by Simon Brown as a response to the shortcomings of traditional architecture diagrams. C4 stands for Context, Containers, Components, and Code—four levels that progressively break down a software system, moving from high-level overviews to detailed design.
Here’s an overview of what each level represents:
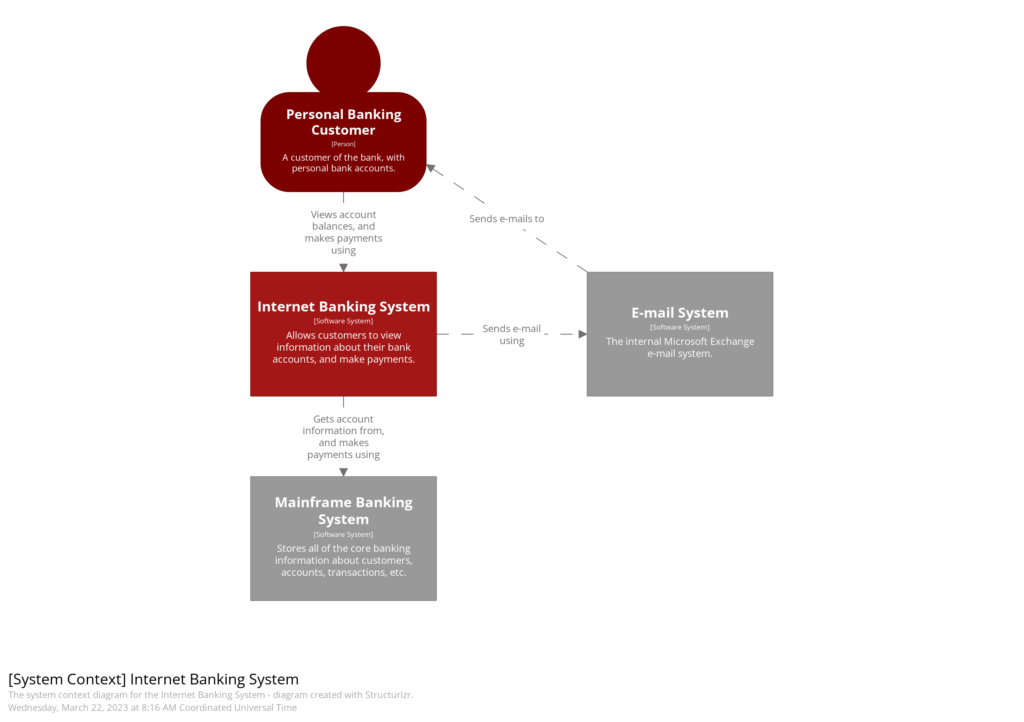
- Context Diagram: Shows how your system fits into its external environment.
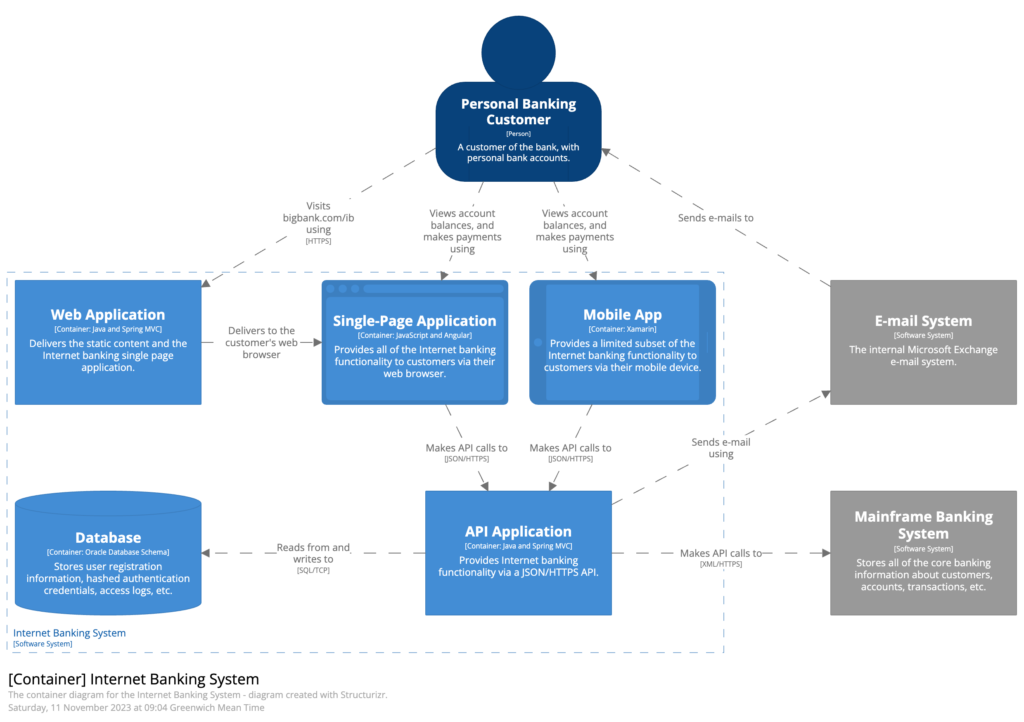
- Container Diagram: Illustrates the major structural building blocks (applications and databases) of your system.
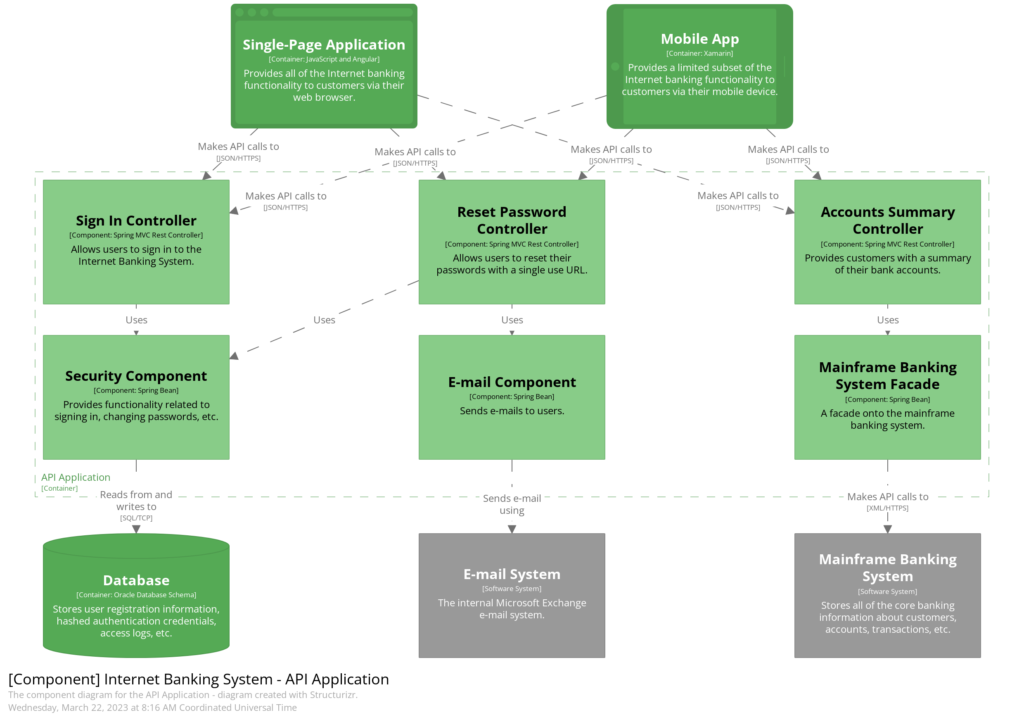
- Component Diagram: Zooms into each container, showing the major components inside each and how they interact.
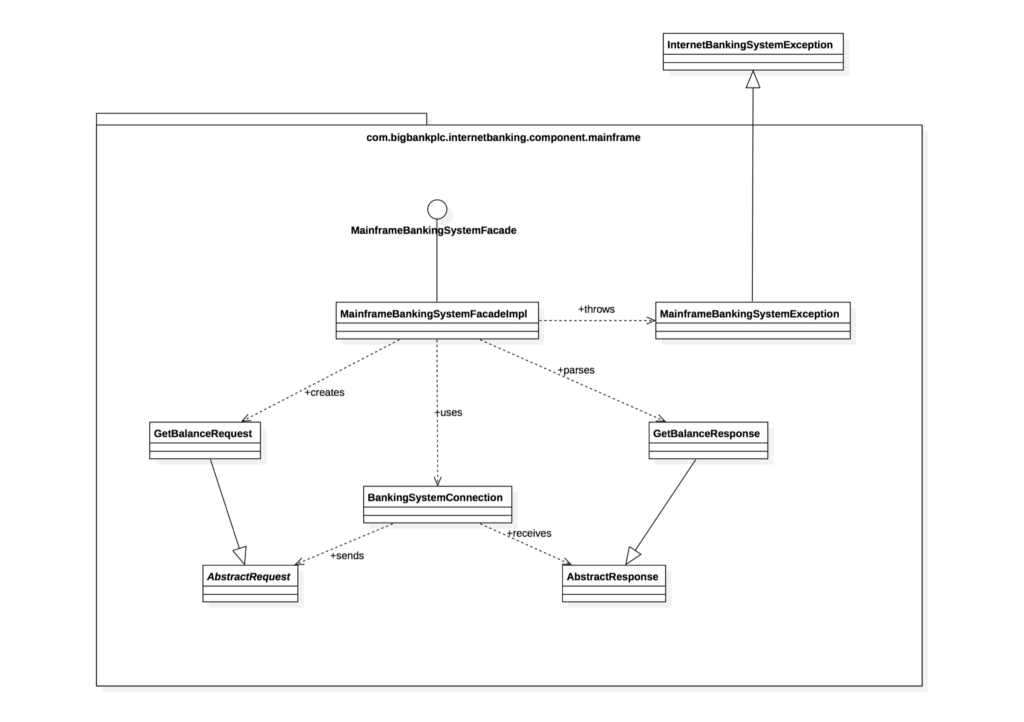
- Code (Class) Diagram: (Optional) Provides a detailed look at the internal structure of components, usually focused on the code level.
2.2. Why Choose the C4 Model?
The C4 Model is gaining popularity because it:
- Simplifies complexity: It breaks down architecture into digestible layers, each focusing on a specific level of abstraction.
- Is consistent and structured: The clear layering allows teams to follow a standardized process, reducing ambiguity.
- Facilitates communication: The diagrams created at different levels help technical and non-technical stakeholders understand the system from their own perspective.
- Is tool-agnostic: The C4 Model can be implemented using various tools, from simple whiteboards to sophisticated diagramming software.
3. Level 1: Context Diagrams

3.1. Purpose of Context Diagrams
A Context Diagram provides the highest-level view of the system. It answers the question: What is this system, and how does it interact with external actors? This diagram includes the system you’re developing and the external entities (such as users, external systems, or third-party services) it interacts with. It doesn’t dive into technical details but helps set the stage for deeper exploration.
3.2. How to Create a Context Diagram
When creating a context diagram, focus on simplicity:
- System as a Black Box: Represent your system as a single box.
- External Entities: Surround the box with all the external systems, users, or services that interact with your system.
- Interactions: Show arrows to depict the flow of data or requests between your system and external entities.
3.3. Examples and Best Practices
For example, if you are building an online banking system, the context diagram might show:
- The banking system at the center.
- External entities like users, payment gateways, third-party credit score services, and mobile applications.
- Interactions such as “User requests account balance” or “Payment gateway processes transaction.”
Best Practices:
- Keep it simple: Include only the most critical external systems and actors.
- Focus on interactions: Show clear data flows between the system and external entities.
- Label everything clearly: Ensure that each actor and system interaction is labeled to avoid confusion.
Example: E-Commerce Platform Context Diagram
Imagine you’re developing an e-commerce platform. The Context Diagram would show your system interacting with:
- Customers: Who use a web or mobile application to browse products, place orders, and track shipments.
- Payment Gateway: A third-party service that processes online payments.
- Warehouse System: A system used for managing stock levels and order fulfillment.
- Shipping Carrier API: External service for calculating shipping costs and tracking deliveries.
This context diagram would show your e-commerce system as a black box at the center, surrounded by the customers, payment gateways, and shipping services, with arrows indicating the flow of information (e.g., customers placing orders, the payment gateway processing transactions).
4. Level 2: Container Diagrams

4.1. Definition of Containers in Software Architecture
In the C4 Model, a Container is a runnable unit in which components live. Containers can represent anything from a web server, desktop application, or database to microservices in the cloud. A Container Diagram zooms in on the system to show the major containers and their interactions. It answers the question: What are the building blocks of this system, and how do they communicate?
4.2. Creating a Container Diagram
To create a Container Diagram:
- Identify the major containers in your system (applications, databases, microservices).
- Draw the interactions between them, including any APIs or message queues.
- Depict technologies: Label each container with the technologies used (e.g., Node.js, MySQL, RabbitMQ).
4.3. Real-World Examples and Usage
For the same online banking system, a container diagram might include:
- A mobile app container that users interact with.
- A web application container handling user logins and transactions.
- A database container storing customer data.
- A payment service container interacting with external gateways.
Example: Microservice-based Architecture for an E-Commerce System
For this same e-commerce platform, a Container Diagram might break down the system into:
- Web Application: Built with React, where users browse and purchase products.
- Mobile Application: A React Native app for mobile users.
- API Gateway: Manages communication between the web/mobile apps and backend services.
- Order Service: A microservice responsible for managing customer orders.
- Payment Service: Interacts with external payment gateways to process transactions.
- Product Catalog Service: Stores and manages product details.
- Database: A MySQL database where all transactional data is stored.
In this diagram, you would show the web and mobile apps interacting with the API Gateway, which then communicates with various backend services like Order Service, Payment Service, and Product Catalog. The database is also included as a container, showing its connections to the services that need to store or retrieve data.
5. Level 3: Component Diagrams

5.1. What Components Represent
Component Diagrams provide a more granular view, zooming into each container to show the major components inside. This diagram answers: What are the main components of each container, and how do they work together?
5.2. Drawing and Interpreting Component Diagrams
To create a component diagram:
- Break down each container into smaller components (e.g., services, classes, modules).
- Show interactions between these components.
- Define responsibilities of each component, including technologies or frameworks.
5.3. Examples and Common Pitfalls
In our banking example, the web application container might be broken down into:
- Authentication service: Manages user logins.
- Transaction service: Handles money transfers.
- Notification service: Sends out email or SMS alerts.
Common Pitfalls:
- Too much detail: Component diagrams can become overwhelming if you try to include every tiny detail. Focus on key components only.
- Ambiguity in interactions: Be clear about how components communicate (e.g., API calls, direct database access).
Example: Order Service Component Breakdown
Zooming into the Order Service container from the previous example, a Component Diagram might break it down into:
- Order Controller: Exposes API endpoints for creating and tracking orders.
- Order Processor: Handles the logic for order creation, including validation and business rules.
- Inventory Manager: Communicates with the Warehouse System to ensure stock availability before confirming an order.
- Payment Coordinator: Interacts with the Payment Service to authorize payments before completing an order.
Each of these components would be represented within the Order Service container, with clear arrows showing interactions between them. For instance, the Order Processor would trigger the Inventory Manager to check stock availability, and if successful, it would call the Payment Coordinator to handle the payment.
6. Level 4: Code (Optional in C4)

6.1. What Code-Level Diagrams Are
At the deepest level, you can zoom in to the Code Diagram, representing the internal structure of a particular component. This often includes class diagrams or UML-style diagrams. However, this level is optional in the C4 model, as many teams prefer not to document code-level details extensively.
6.2. When to Use Code Diagrams
Use this level only when needed to clarify the internal workings of a component. This is particularly useful when dealing with complex algorithms or custom frameworks.
Example: Code-Level Class Diagram for Payment Processing
If you decided to go one level deeper into the Payment Coordinator component, you might create a class diagram showing its internal code structure:
- PaymentProcessor Class: Handles the main logic for processing payments.
- GatewayAdapter Class: Acts as a bridge to various external payment gateways (e.g., Stripe, PayPal).
- Transaction Class: Represents individual payment transactions, holding data like amount, status, and payment method.
The PaymentProcessor class would depend on the GatewayAdapter class, which abstracts away the details of interacting with specific payment providers. The Transaction class would store the outcome of each payment attempt.
7. Tools for Creating C4 Diagrams
7.1. Overview of Popular Tools
There are various tools to help you create C4 diagrams:
- Structurizr: Designed specifically for the C4 Model, with features for creating and maintaining architecture diagrams.
- PlantUML: A text-based diagramming tool that supports C4.
- Lucidchart: A visual diagramming tool that can be adapted for C4 with custom shapes.
7.2. Tips on Tool Selection
Choose a tool based on:
- Team size: For larger teams, tools like Structurizr offer collaboration features.
- Integration: Ensure the tool integrates with your CI/CD pipeline if needed.
- Customization: If you need flexibility, text-based tools like PlantUML offer great customization.
Example: Tool Comparison
Here’s a comparison between popular tools based on an e-commerce platform:
- Structurizr: If you’re diagramming your e-commerce platform’s architecture, Structurizr is a great option. It is tailored for the C4 Model and allows you to keep your architecture diagrams up-to-date as your system evolves. You can easily update the context, container, and component diagrams as the architecture changes.
- PlantUML: If you prefer writing diagrams in plain text, PlantUML is useful. You could script a Container Diagram for your e-commerce system, showing interactions between services like API Gateway, Order Service, and Payment Service, and then export it into a visual format.
- Lucidchart: A more general-purpose tool, Lucidchart offers drag-and-drop diagram creation. If your team prefers a highly visual and collaborative platform for diagramming, Lucidchart can work well for creating all levels of C4 diagrams, especially if non-technical stakeholders need to review them.
8. Best Practices for Software Architecture Diagrams
8.1. General Best Practices
- Consistency: Use the same notation across all diagrams.
- Simplicity: Avoid overloading diagrams with too much information.
- Hierarchy: Use the C4 Model’s layered approach to provide a clear hierarchy of information.
8.2. Avoiding Overcomplication
While it’s tempting to add every detail, stick to high-level abstractions unless absolutely necessary. Each diagram should be easily understandable by its intended audience.
8.3. Keeping Diagrams Up-to-Date
Outdated diagrams cause confusion. Assign responsibility to keep diagrams updated alongside system changes, using automation where possible.
Example: Simplifying an Overcomplicated Diagram
Let’s say you start creating a Component Diagram for your e-commerce platform’s Order Service, and you’ve included every detail—internal service interactions, data flows, error handling, etc. The diagram becomes cluttered and difficult to follow.
Solution: Simplify by focusing only on the core components (e.g., Order Controller, Inventory Manager, and Payment Coordinator) and showing their main interactions. Leave out the internal implementation details unless they’re critical for understanding. You can create separate diagrams for those details if needed.
9. Challenges and Misconceptions
9.1. Common Mistakes in Using C4 Model
- Over-diagramming: Don’t feel compelled to create all four levels if they aren’t necessary.
- Too much code focus: The C4 Model is not meant to replace code-level documentation. It’s a high-level tool for visualizing architecture.
9.2. How to Address These Challenges
Stick to the purpose of each diagram. If you’re using the C4 Model as a communication tool, focus on the level of detail needed by your audience.
10. Conclusion
Software architecture diagrams are essential for modern software development, and the C4 Model provides a powerful yet simple way to organize and present this information. By breaking down systems into context, container, component, and (optionally) code levels, software engineers can visualize architecture in a way that is accessible and actionable for all stakeholders. Whether you’re building a small service or a large-scale distributed system, the C4 Model should be part of your toolkit to ensure clarity, consistency, and effective communication.
